Applications open, taking on a few SaaS clients for Q3 2026. Engagements from $5,000/mo. See how it works

SaaS SEO case studies

Three campaigns, with the strategy and the analytics behind each. Also an honest note about what they are: high-ticket B2B and e-commerce, running on the same economics as SaaS, plus our own software ranked in public.

All figures from client Ahrefs / Search Console · Screenshots under NDA

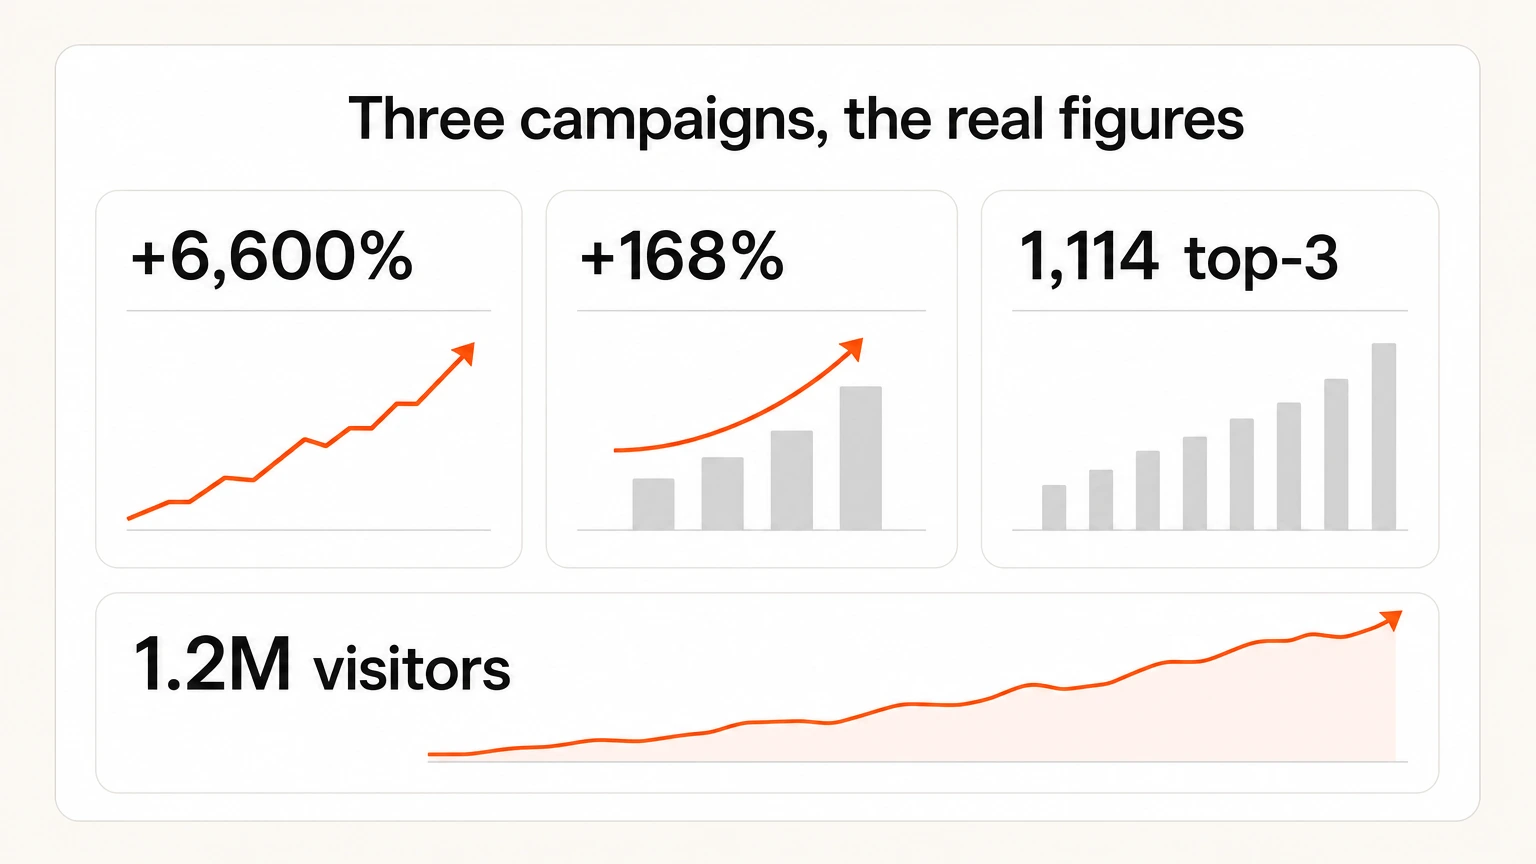
Four headline campaign figures, traffic up 6,600 percent, clicks up 168 percent, 1,114 top-3 keywords
Read this first

What these case studies are, and are not

Our flagship campaigns are high-ticket B2B and e-commerce, not named SaaS logos. We could dress them up as SaaS. We would rather tell you what they are and let you judge whether the economics transfer.

They do, in our view: long consideration cycles, high lifetime value, and a buyer who researches thoroughly before contacting sales. The plays. Bottom-funnel pages, technical remediation, earned authority, are the same ones we would run on your software. We are also running them on PRWiz, our own product, in public.

All figures from client Ahrefs / Search ConsoleScreenshots available under NDATimeframes stated, never hidden
Campaigns

Three campaigns in detail

Each with the strategy, the sequence and the numbers.

High-ticket B2B · Immigration
+6,600%
organic traffic in 16 months

A firm where each lead is worth $10K–$100K, competing against decade-old legal domains. We won it on bottom-funnel intent rather than volume: linkable resource assets first, then guest placements and niche edits, then a skyscraper campaign displacing competitor citations, then entity and NLP work that produced the top-3 surge. Ended at #2 for the keyword buyers use immediately before choosing a firm.

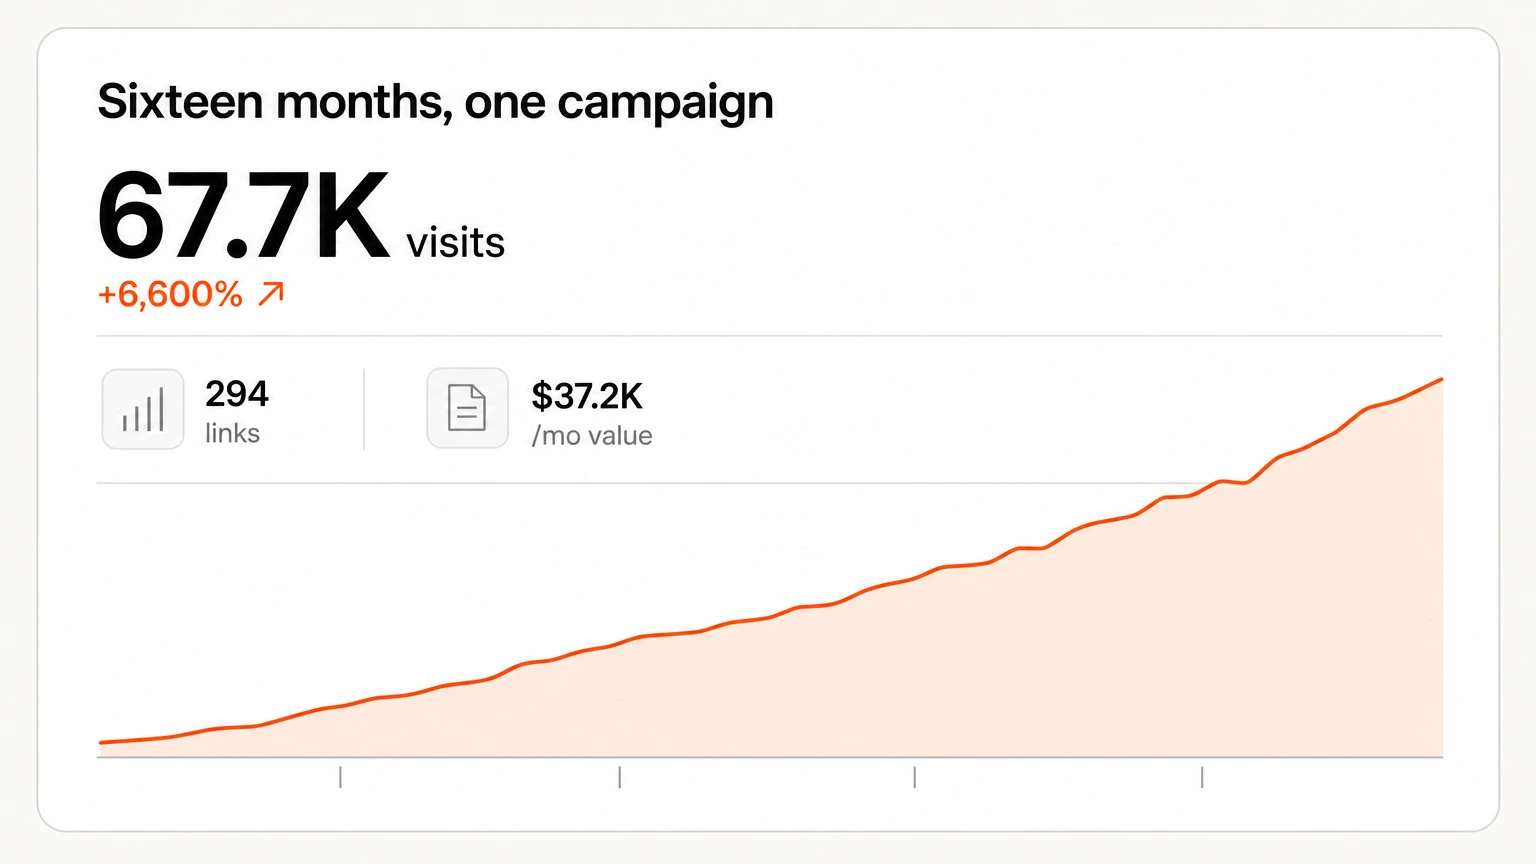
A campaign chart showing traffic up 6,600 percent to 67.7K monthly visits and 294 earned links
294 links built1,114 top-3 keywords67.7K monthly visits$37.2K/mo traffic value
Read the full study
E-commerce · Technical depth
+168%
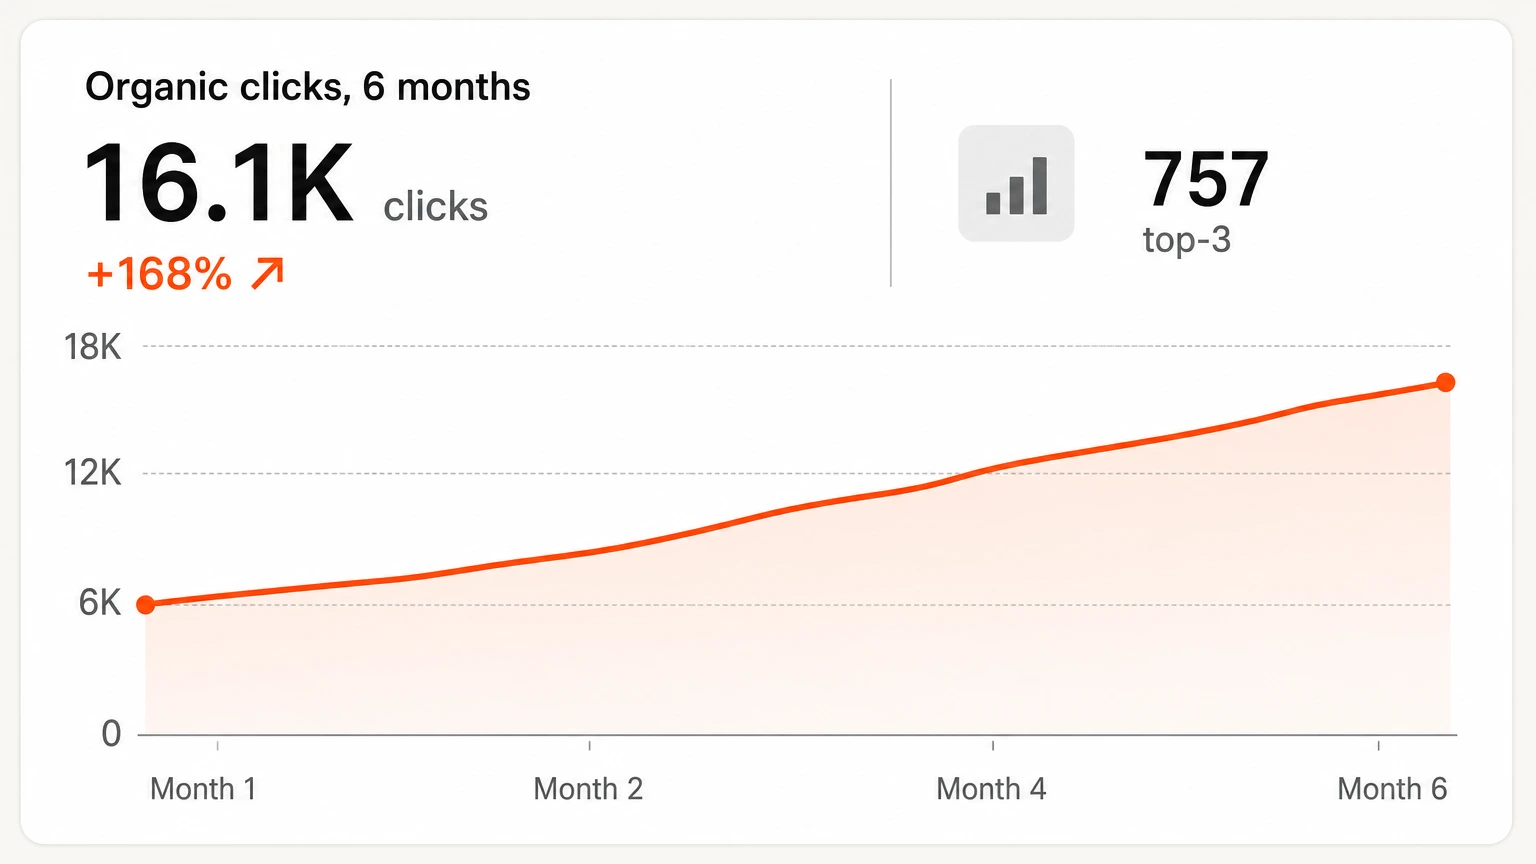
organic clicks in 6 months

A premium at-home waxing brand in a niche dominated by legacy players with deep content libraries. Won with the full stack rather than one tactic: 100+ technical errors fixed including crawl-blocking double-slash URLs, 99 existing posts rewritten for intent, nine product pages restructured with schema, and 54 earned links. Product pages became the category authority, which is where the revenue sat.

An analytics card showing monthly organic clicks rising 168 percent over six months to 16,100
54 links99 posts rewritten58→757 top-3 keywords6K→16.1K clicks
Read the full study
Portfolio · Operations at scale
1.2M
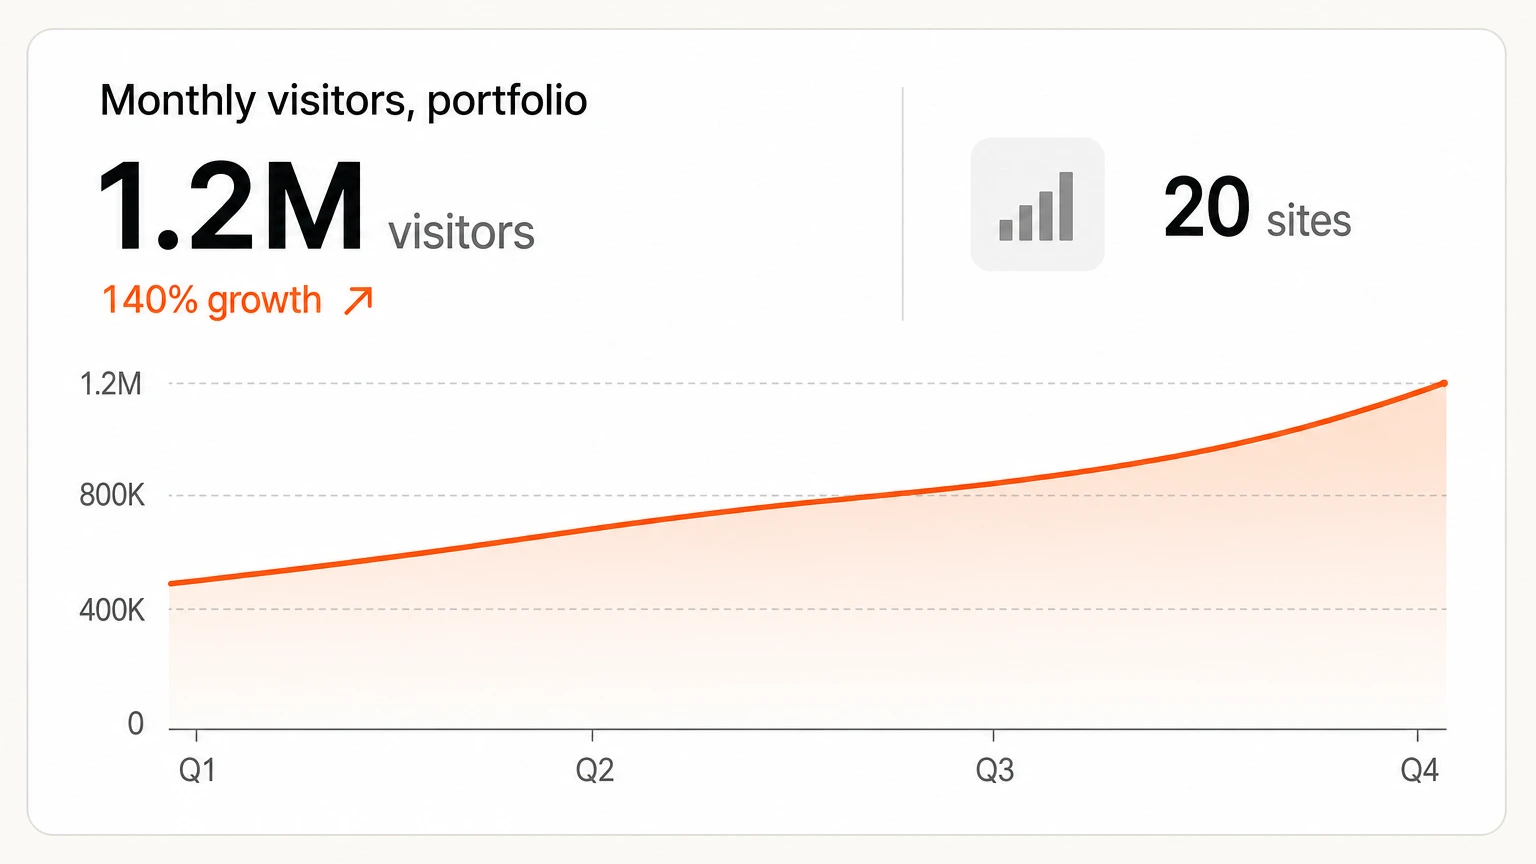
monthly visitors, from 500K

Forrest Webber had 20 sites and a stack of freelancers, writers, link builders, WordPress VAs, on different schedules with different quality bars. We absorbed five workstreams into one team: content strategy per site, advanced link building, technical audits, WordPress management and reporting. Featured on Niche Pursuits.

An analytics card showing portfolio monthly visitors rising from 500,000 to 1.2 million across 20 sites
20 sites, one team140% revenue growth$40K/m peak revenue5+ vendors replaced
Read the full study
Side by side

The three campaigns compared

Same table, same columns, so the differences in starting position and timeframe are visible rather than buried in three separate write-ups.

The three Authority Magnet campaigns compared by category, timeframe, headline result and what was built
CampaignCategoryTimeframe Headline resultWhat was built
Immigration service providerHigh-ticket B2B services16 months +6,600% organic traffic, 1,114 top-3 keywords294 links, linkable assets, entity and NLP work
Wellness brandE-commerce6 months +168% organic clicks, 58→757 top-3 keywords54 links, 99 posts rewritten, 100+ technical fixes
Niche portfolioPortfolio operationsMulti-year 500K→1.2M monthly visitors, 140% revenue growth20 sites, five workstreams absorbed into one team

Starting position differs in every row, and a percentage from a small base is easier than the same percentage from a large one. That is why the absolute figures sit beside the percentages.

The screenshots

The underlying charts

Client dashboards behind two of the campaigns above. Client identity is removed from every capture, which is why there is no domain in any header. Each caption states the tool, the exact date range shown in the image, and the metric plotted.

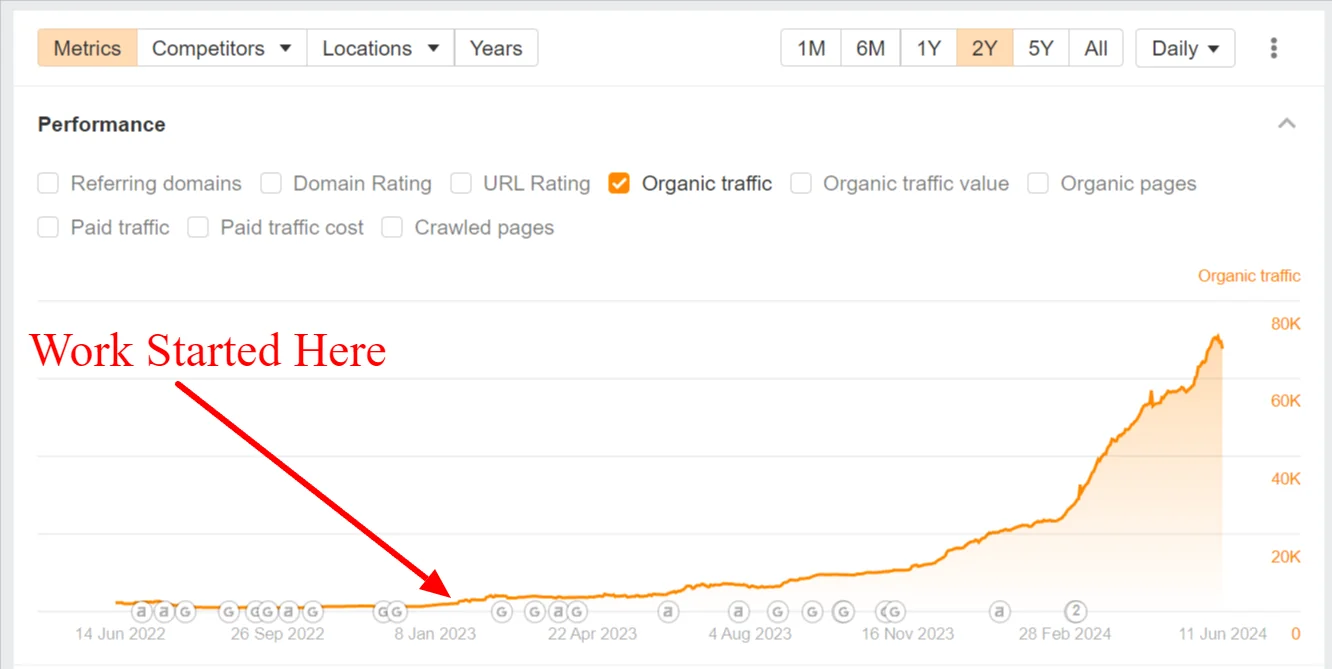
Ahrefs organic traffic climbing from near zero to almost 80,000 monthly visits after work began
Ahrefs, Site Explorer organic traffic, daily, 14 Jun 2022 to 11 Jun 2024. The red annotation marking where work started is on the original capture and sits at approximately January 2023. Peak just under 80K estimated monthly organic visits.
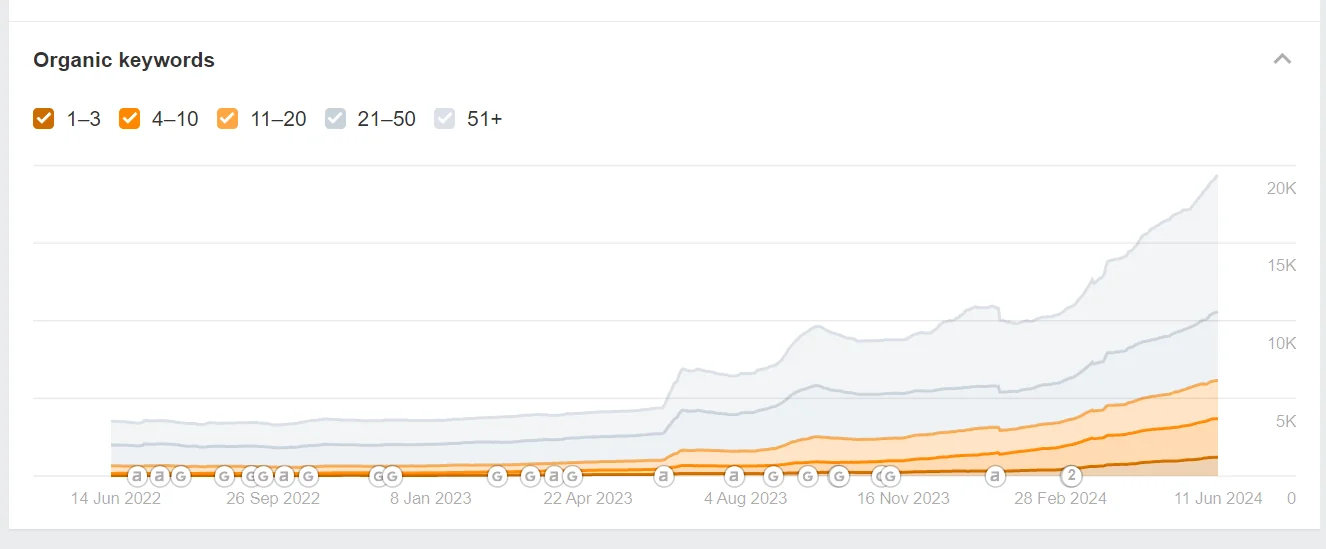
Stacked area chart of ranking keywords by position bucket rising from about 5,000 to over 20,000
Ahrefs, organic keywords by position bucket, 14 Jun 2022 to 11 Jun 2024. Total ranking keywords rise from roughly 5K to just over 20K, with the positions 1 to 3 band expanding from mid-2023 onward.
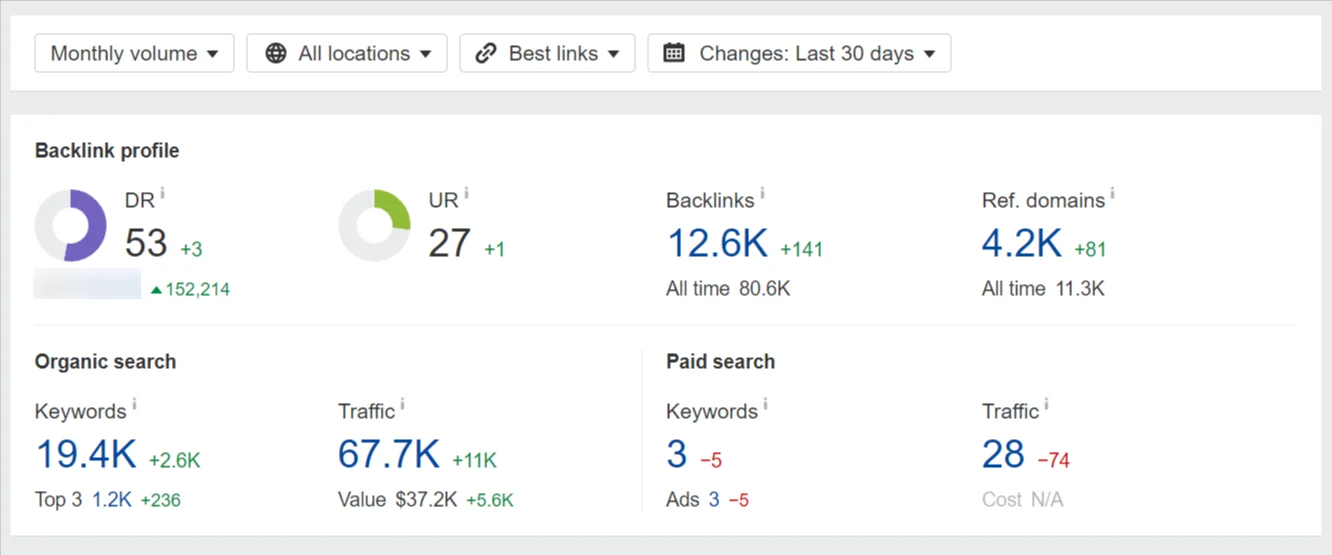
Ahrefs overview tiles showing domain rating 53, 19.4K keywords and 67.7K organic traffic
Ahrefs, Site Explorer overview, changes over the last 30 days as of the capture. DR 53, 12.6K live backlinks from 4.2K referring domains, 19.4K organic keywords, 1.2K in the top 3, 67.7K estimated monthly traffic, $37.2K estimated monthly traffic value. Traffic value is Ahrefs' estimate of equivalent paid spend, not revenue. The metric blurred under the DR dial was redacted on the original capture.
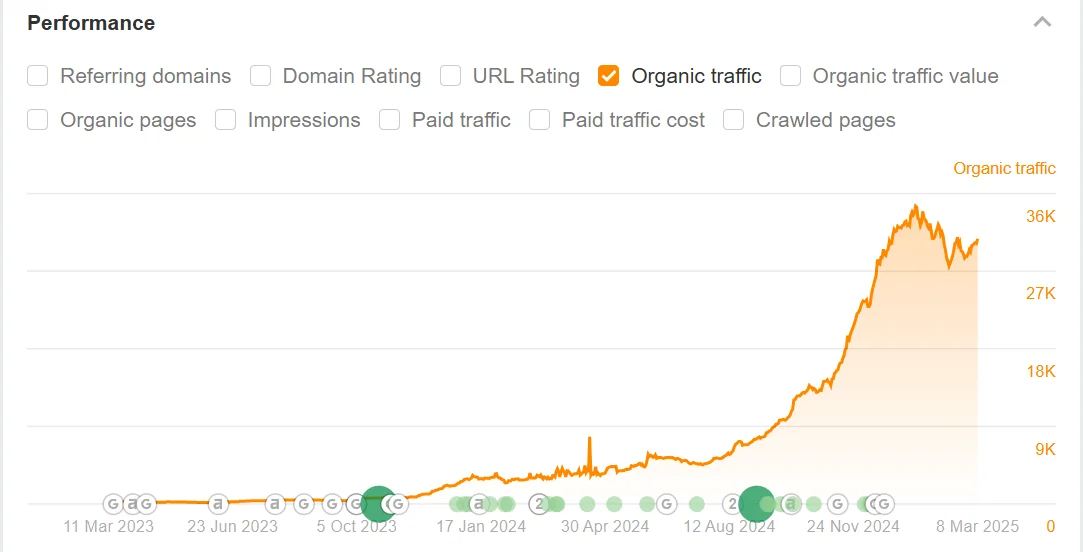
Ahrefs organic traffic for the wellness brand rising sharply from late 2024 to about 36,000
Ahrefs, Site Explorer organic traffic, 11 Mar 2023 to 8 Mar 2025. Estimated organic traffic climbs from roughly 3K to a peak near 36K, settling around 33K. Ahrefs estimates are modelled from its own keyword and clickstream data and run higher than the Search Console click counts quoted in the campaign summary above, which are actuals.
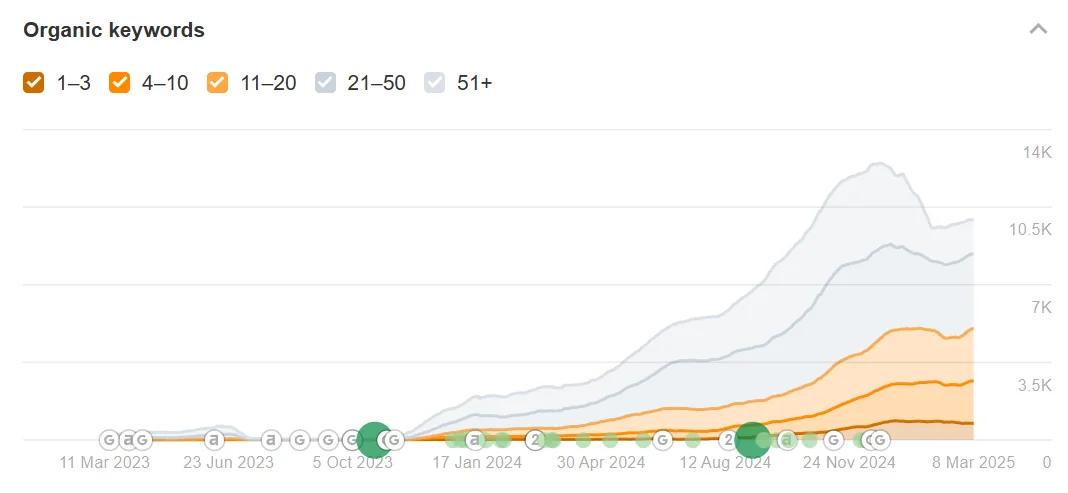
Wellness brand ranking keywords peaking near 14,000 in late 2024 then settling around 11,000
Ahrefs, organic keywords by position bucket, 11 Mar 2023 to 8 Mar 2025. Total ranking keywords peak near 14K around November 2024, dip, then recover to roughly 11K by March 2025. The dip is shown rather than cropped.
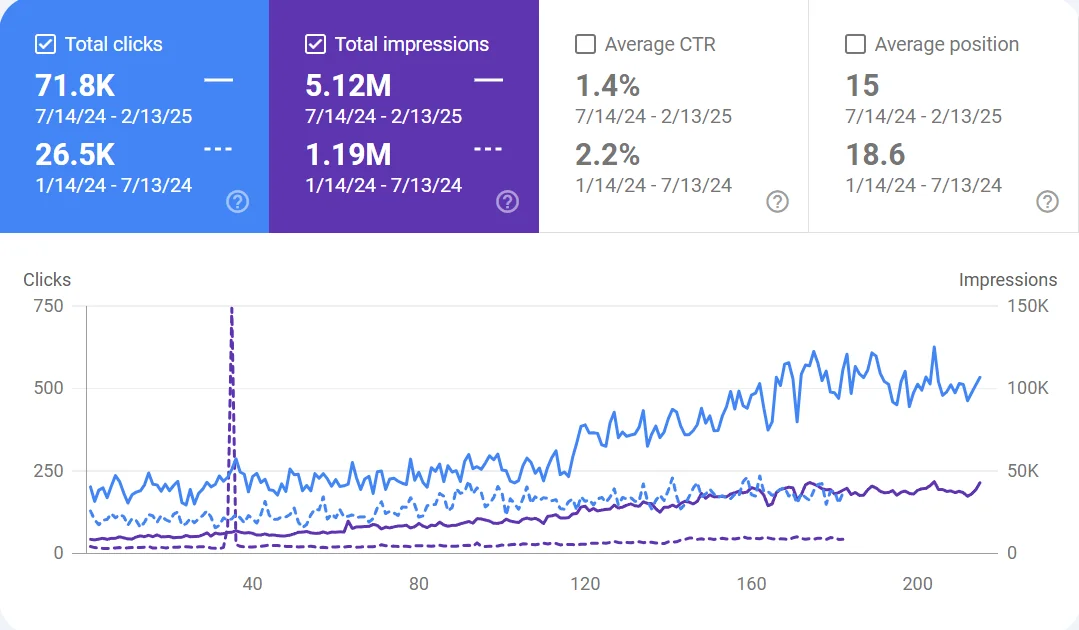
Search Console comparison showing clicks 26.5K to 71.8K and impressions 1.19M to 5.12M across two periods
Google Search Console · 14 July 2024 to 13 February 2025, compared with the preceding period, 14 January to 13 July 2024. Total clicks 71.8K against 26.5K, total impressions 5.12M against 1.19M, average CTR 1.4% against 2.2%, average position 15 against 18.6. This is a later and different window from the six-month campaign that produced the +168% figure above, and is shown as that rather than merged into it.

The CTR line in that capture is the one an SEO-literate reader will stop on, so here is why it fell. Clicks grew roughly 2.7 times, from 26.5K to 71.8K, while impressions grew roughly 4.3 times, from 1.19M to 5.12M. The site had started surfacing for a far wider set of head terms it previously did not appear for at all, most of them lower on the page, so the denominator grew faster than the numerator and the average fell from 2.2% to 1.4%. Average position improved from 18.6 to 15 across the same comparison. The full working is on the ecommerce case study.

In their words

The portfolio client, in his own words

Forrest Webber is the client behind the portfolio engagement above. His review is reproduced here exactly as written.

Forrest Webber in dramatic side lighting against a black studio backdrop
Forrest Webber
Owner, Wander Media LLC

I am so glad we found Authority Magnet for our portfolio. No more going through countless services, paying an arm and a leg for link building or the frustration of running an in-house campaign. They handle all!

While Mohammad and his team focus on providing world-class link building services, I can focus on what I do best! Win-Win.

Verified review

All 20 client reviews, including five on camera with transcripts.

In public

Our own SaaS, ranked in public

The honest gap in the case studies above is a named SaaS logo. We are closing it the only way that is not a slide: by building software and ranking it ourselves.

10,000+
Vetted publishers in the PRWiz marketplace, built in-house.
150,000+
Publishers in the wider database with verified pricing.
Same playbook
Bottom-funnel pages, technical base, earned links, AI citations.
Watchable
You can check our rankings and citation share yourself, any time.
See it: PRWiz →

What transfers to a SaaS program

Reasonable question when the case studies are B2B services and e-commerce: which parts of this actually apply to software? Specifically these.

From the immigration campaign

The sequencing. Linkable assets before outreach, guest placements before skyscraper work, entity and NLP refinement last once authority existed to support it. That order is why the top-3 count went from ten to over eleven hundred rather than plateauing, and the full immigration study sets out all five stages with the months each one ran. The same sequence applies directly to a SaaS category with entrenched incumbents, and the economics match, since a $10K–$100K lead behaves like an enterprise software deal.

From the wellness campaign

The technical half. Over a hundred errors fixed, including crawl-blocking URL structure problems, before content work began. The lesson generalizes exactly: 99 rewritten posts would have produced nothing on a site Google could not crawl properly, and the full ecommerce study explains what the crawl problem actually was. SaaS sites carry heavier versions of the same problems through JavaScript rendering.

From the portfolio engagement

Operations at scale. Twenty sites with consistent quality is a production-systems problem, which is the same problem as programmatic SEO across hundreds of integration and use-case pages. The constraint is never ideas; it is a repeatable process that does not degrade at volume, and the full portfolio study lists the five workstreams that were consolidated to get there.

What does not transfer

Trial-funnel conversion optimization and product-led content are genuinely different for software, and our named-client evidence there is thinner. That is exactly why we are building and ranking PRWiz in public rather than claiming the experience.
What these numbers do not tell you

Case studies are marketing. Here is what ours leave out, so you can weigh them properly.

  • Starting position matters enormously. A percentage gain from a small base is easier than the same gain from a large one. The +6,600% figure started from a low baseline, and we should say so.
  • You are seeing the successes. Not every campaign we have run produced results like these. Some categories turned out harder than our initial analysis suggested.
  • Traffic value is an estimate. The $37.2K/month figure is Ahrefs' calculation of equivalent paid spend, not revenue. It is a useful proxy and not a bank statement.
  • Client effort is invisible here. Every campaign above involved a client who approved technical changes quickly and turned content reviews around fast. That is a real variable and it is not ours to claim.
  • Timeframes were long. Sixteen months, six months, multi-year. Nothing here happened in a quarter.
A better question than "can you do this for us"

Ask us what we think is realistic for your category, your domain and your competitive set, and ask what would have to be true for it to fail. That conversation is more useful than any figure on this page.

FAQ

Questions about these results

Including the one about SaaS logos.

Ask about your category
Do you have SaaS-specific case studies?
Not with named SaaS logos yet, and we would rather say so than imply otherwise. Our flagship campaigns are high-ticket B2B and e-commerce, which run on identical economics, long consideration cycles, high lifetime value, a buyer who researches before contacting sales. We are also running the same playbook on PRWiz, our own software product, in public.
Are these results verified?
Every figure comes from the client's own Ahrefs or Google Search Console, not from our estimates. Where we cite traffic value it is Ahrefs' calculation of equivalent paid spend, and we label it as such. Screenshots are available under NDA on request.
How long did these campaigns take?
The immigration campaign ran sixteen months to reach +6,600%. The wellness campaign reached +168% in six months. The portfolio engagement is a multi-year partnership. None of these were ninety-day sprints, and anyone showing you a ninety-day transformation is showing you a keyword nobody searches.
Can you get similar results for my SaaS?
Honestly, it depends on your category, domain history, technical base and how competitive your terms are. What transfers is the method rather than the multiplier. We will tell you what we think is realistic for your specific situation before you sign, which is a less exciting answer than a guarantee but a more useful one.
Why is there no client name or domain on any of the screenshots?
Because both clients are under NDA and asked not to be identified, which is why they appear here as an immigration service provider and a wellness brand. Every capture is cropped to the chart itself, with no Ahrefs header, no Search Console property selector and no address bar, and the keyword views are position-bucket charts rather than keyword tables so no individual term can identify the site. The unredacted versions are available under NDA on request.

Want your numbers on this page?

Tell us the category and the competitors. We will tell you what we think is realistic, including when the honest answer is not much.

From $5,000/mo · Realistic targets, stated before you sign