SaaS SEO metrics that survive a board meeting
Six metrics decide whether SaaS SEO is working, and sessions is not one of them. Formulas, benchmarks, the AI-visibility set almost nobody tracks yet, and a one-slide board report template.
Which SaaS SEO metrics matter?
Six metrics decide whether a SaaS SEO program is working: organic trials and demos, product-qualified leads, organic pipeline influenced, CAC payback against paid, conversion rate by page type, and AI citation share. Two business metrics translate those for executives: MRR and ARR influenced by organic.
Everything else, rankings, sessions, impressions, domain authority, is a leading indicator. Worth tracking weekly, never worth presenting as a result. The distinction is the whole discipline.
Revenue metrics: what the board asks about
These are the only SEO numbers most executives genuinely care about. If your reporting cannot produce them, the channel will lose budget arguments to paid regardless of how well it is performing.
1. ARR influenced by organic
The headline number. Annual recurring revenue from customers whose first or last touch before converting was an organic page. Report both attribution models rather than picking the flattering one.
ARR influenced = organic trials × trial-to-paid rate × average contract value
2. Organic CAC and CAC payback
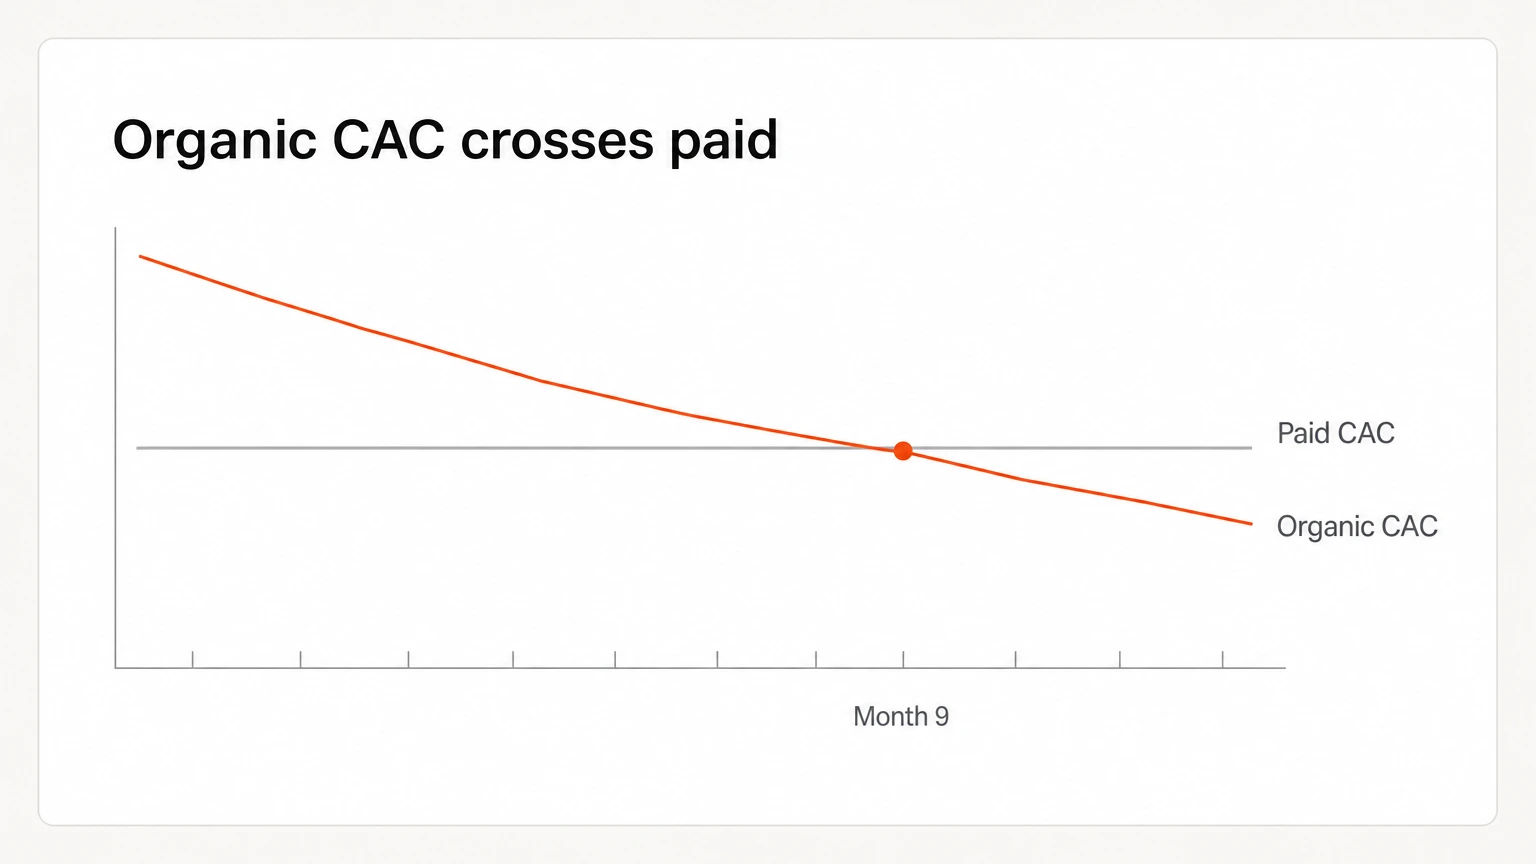
The comparison that wins budget. What it costs to acquire a customer through organic versus paid, and how many months of subscription revenue it takes to recover that cost.
Organic CAC = total SEO investment ÷ new customers from organic
CAC payback (months) = organic CAC ÷ (ACV ÷ 12 × gross margin)
3. Organic share of new ARR
Channel mix. Rising organic share is the clearest evidence the investment is reducing dependence on paid acquisition.
Organic share = ARR influenced by organic ÷ total new ARR × 100
4. Retention of organic cohorts
The metric almost nobody tracks, and the one that separates good traffic from good customers. If organic signups churn faster than paid ones, you are ranking for the wrong intent.
12-month logo retention: organic cohort vs paid cohort vs referral cohort
Pipeline metrics: the monthly operating numbers
These move faster than revenue and are what an agency should be held to month by month.
| Metric | Definition | Benchmark / note |
|---|---|---|
| Organic trials | Free-trial signups whose session originated from organic search | The primary monthly number for self-serve products |
| Organic demos | Demo bookings attributed to organic | The equivalent for sales-assisted products |
| PQLs | Trial users who hit a defined product-usage threshold | Typically 20–35% of trials, depending on your threshold |
| SQLs | Leads sales accepts as worth working | Watch the trial-to-SQL rate by landing page type |
| Pipeline influenced | Total deal value where an organic page appears in the touch history | Report alongside pipeline created to avoid overclaiming |
| Conversion rate by page type | Trial or demo rate per template. Comparison, alternative, use-case, blog | Comparison pages commonly convert 2–3× blog traffic |
| Assisted conversions | Deals where organic content was touched but was not first or last | Where top-of-funnel content earns its keep |
Report every pipeline metric split by page type. Aggregate conversion rate hides the fact that your comparison pages might convert at 6% while your blog converts at 0.4%. That single split usually reallocates the entire content budget.
AI visibility metrics
Buyers now shortlist inside AI answers, and that visibility moves independently of your Google rankings. Almost no SaaS company measures it. Here is the set worth instrumenting.
Build a fixed set of 20–50 buyer prompts. The questions your sales team hears, and run them across each engine on a weekly or monthly schedule. Record whether you appear, in what position, and which sources the answer cited. Baseline before you change anything, or you will have no way to prove movement later.
Leading indicators worth watching weekly
None of these are results. All of them tell you whether results are coming, which makes them the early-warning system for a program.
| Indicator | What it tells you | Watch for |
|---|---|---|
| Top-3 commercial keywords | Whether high-intent visibility is growing | Count, never average position across all terms |
| Indexed vs published | Whether Google can see what you shipped | A widening gap means a technical problem, not a content one |
| Referring domains earned | Authority trajectory | Quality and relevance over raw count |
| Crawl stats | Whether budget is spent on pages that matter | Crawl volume on application routes is wasted budget |
| Core Web Vitals | Technical health and user experience | Field data, not lab scores |
| Impression growth on target terms | Early visibility before clicks arrive | Rising impressions with flat clicks means a title or intent mismatch |
| Branded search volume | Whether the program is creating demand | The most underrated signal that content is landing |
What not to report as a result
Every metric below has legitimate diagnostic uses. None of them belong at the top of a monthly report.
Vanity metrics
- Total sessions. Includes bots, existing customers logging in, and job seekers. Grows without revenue moving.
- Total impressions. Rises when you rank at position 40 for more things. Means almost nothing alone.
- Average position. Mixes your money keywords with irrelevant long-tail. Mathematically valid, practically useless.
- Domain authority. A third-party estimate, not a Google signal. Fine as a directional proxy, never a goal.
- Articles published. An output. Nobody in the buying committee cares how many you shipped.
- Total keywords ranking. Inflated by accidental long-tail. Count only commercial terms in the top three.
- Bounce rate. A high bounce on a page that answered the question completely is a success, not a failure.
The substitution
- Sessions → organic sessions on commercial-intent pages
- Impressions → impressions on mapped target keywords only
- Average position → count of top-three commercial keywords
- Domain authority → referring domains earned this quarter
- Articles published → pages ranking in the top ten within 90 days of publishing
- Total keywords → keywords in positions one to three with buying intent
- Bounce rate → scroll depth and conversion rate by page type
Formula reference
Everything in one place, so you can build the dashboard without hunting through the page.
| Metric | Formula | Benchmark |
|---|---|---|
| ARR influenced | trials × trial-to-paid rate × ACV | n/a |
| Organic CAC | SEO spend ÷ new customers from organic | Should fall below paid CAC by month 9–12 |
| CAC payback | CAC ÷ (ACV ÷ 12 × gross margin) | Under 12 months |
| Trial-to-paid rate | paid conversions ÷ trials started | 8–15% self-serve |
| Demo-to-opportunity | opportunities ÷ demos held | 15–25% sales-assisted |
| PQL rate | trials hitting usage threshold ÷ total trials | 20–35% |
| Page conversion rate | conversions ÷ unique organic sessions on that template | Comparison pages 2–3× blog |
| Citation share | prompts where you appear ÷ total prompts tracked | Baseline first, then target +10pts/quarter |
| Organic share of ARR | organic ARR ÷ total new ARR | 25–40% at maturity |
| Content ROI | (ARR influenced − production cost) ÷ production cost | Assess at 12 months, not 3 |
How to instrument this
Most SaaS companies cannot report these numbers, and the reason is almost never the tooling. It is that organic sessions and CRM records were never connected.
- Capture first and last touch on every lead record. Two fields in your CRM, populated at signup. This single change unlocks most of the reporting above.
- Tag landing page and page template on the lead. Not just the URL. The template type, so you can aggregate by comparison, alternative, use-case or blog.
- Define your PQL threshold explicitly. A specific in-product action, agreed with sales, that predicts conversion. Without this, PQL reporting is guesswork.
- Connect Search Console to your warehouse. The API retains more than the interface shows, and you will want the history later.
- Build the AI prompt set and schedule it. Twenty to fifty buyer questions, run across engines on a fixed cadence, results stored so trends are visible.
- Separate customer traffic from prospect traffic. Logged-in sessions pollute every conversion metric. Exclude them at the analytics layer.
- Report a range, not a number, on attribution. Show first-touch and last-touch side by side. Anyone presenting a single attributed figure is hiding a modeling choice.
If you do nothing else: add first-touch and last-touch fields to your CRM, and tag page template on every lead. Those two changes take a fortnight and make the difference between guessing and knowing which pages produce revenue.
The one-slide board report
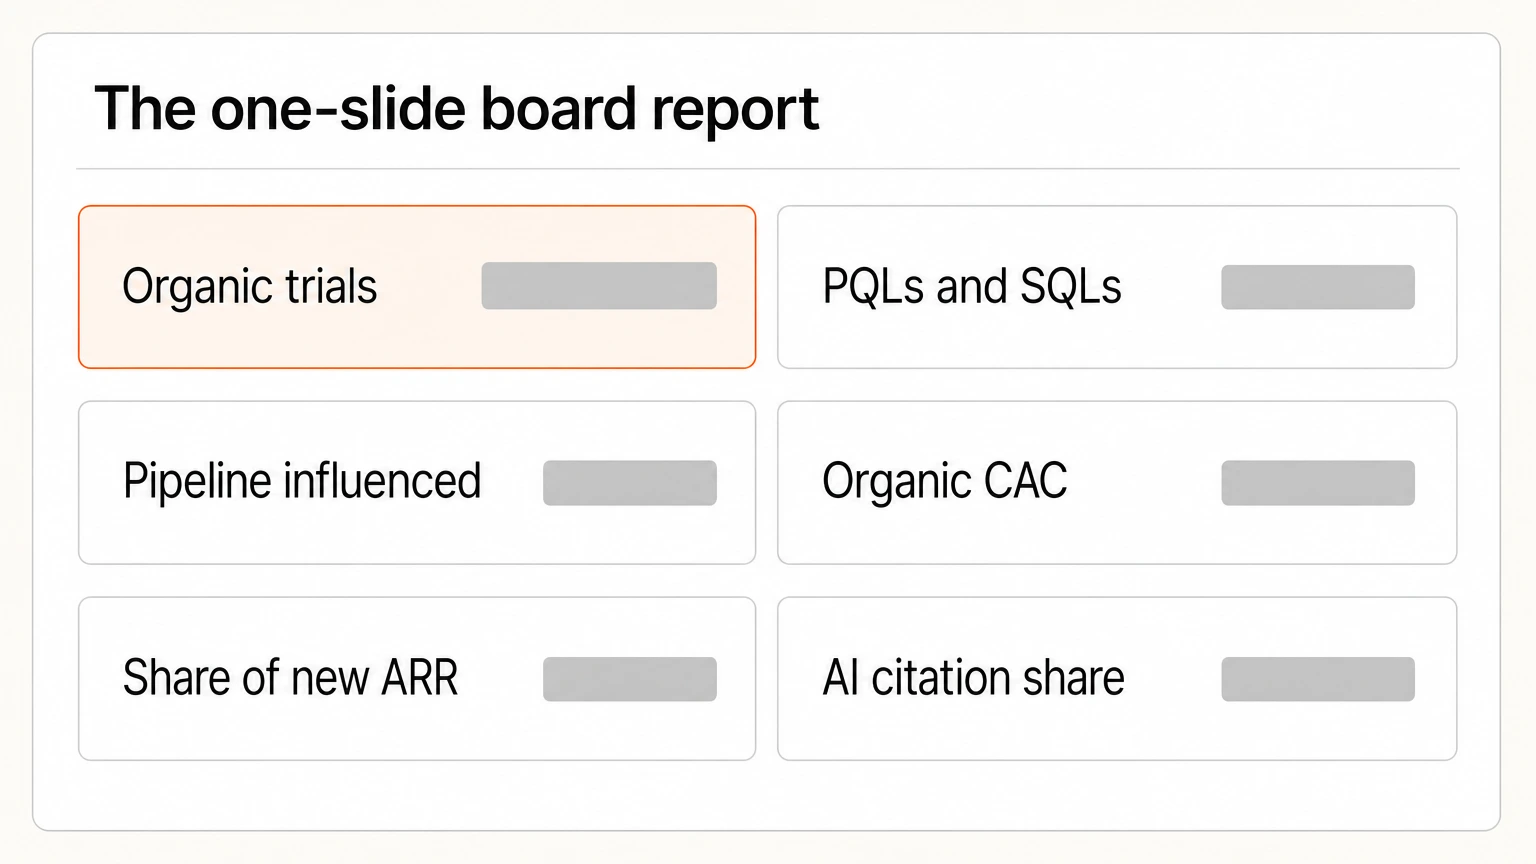
Seven numbers. If your monthly SEO report needs more than one slide for an executive audience, it is reporting activity rather than outcomes.
The slide
- Organic trials / demos this month, vs last, vs target
- PQLs and SQLs from organic
- Pipeline influenced by organic
- Organic CAC vs paid CAC, rolling 12 months
- Organic share of new ARR
- AI citation share, with movement
- One sentence on what changed and what happens next
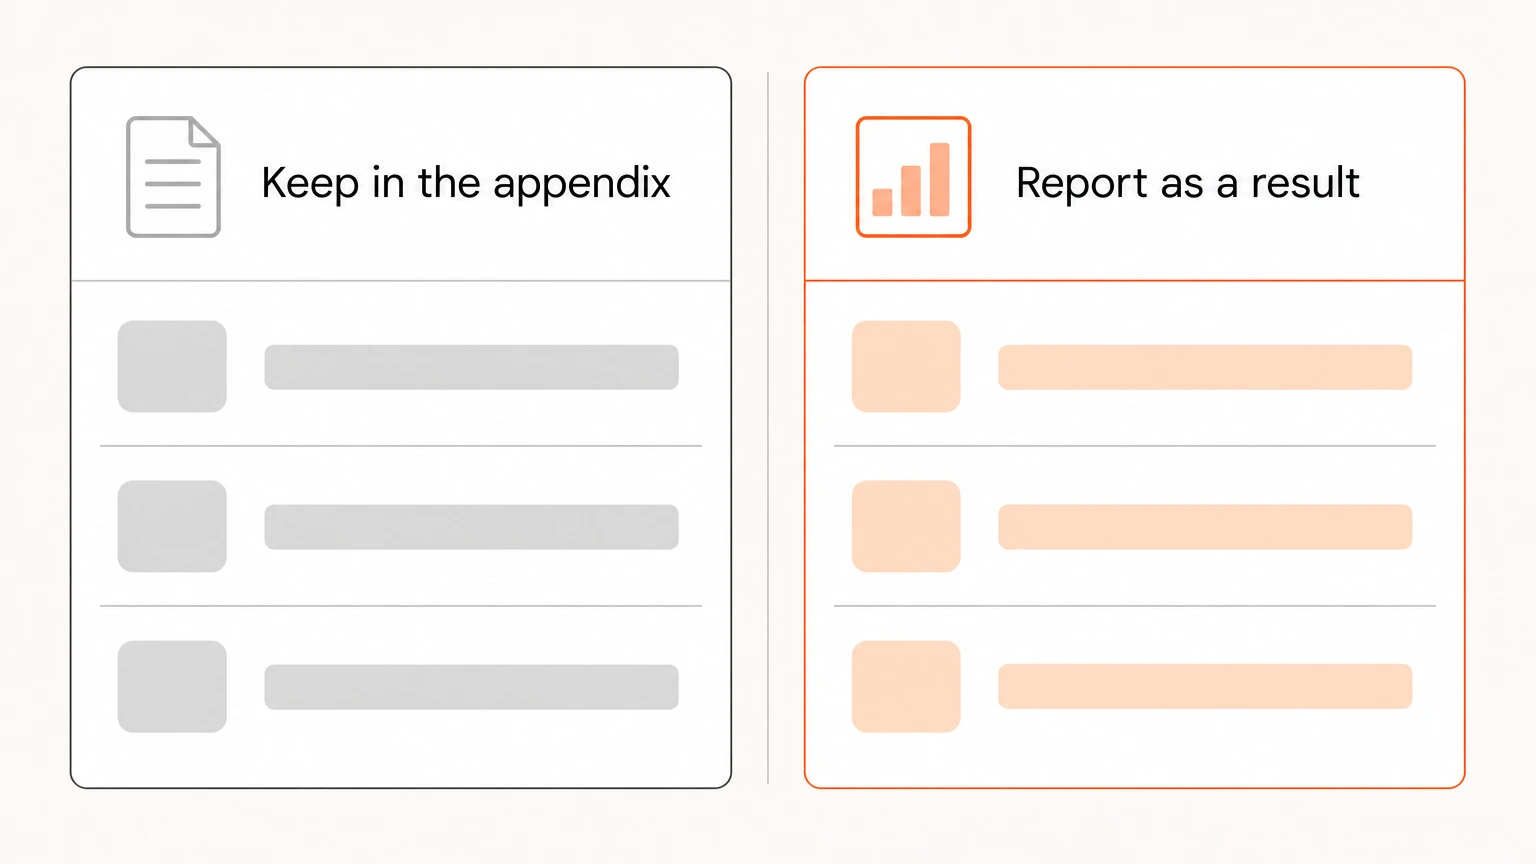
Keep in the appendix
- Keyword position tables
- Traffic charts by source
- Technical fix logs
- Content shipped this month
- Backlink acquisition detail
Measurement questions
What teams ask when they start reporting SEO to a board.
Talk to us about reportingWhat are the most important SaaS SEO metrics?
How do you measure SEO ROI for a SaaS company?
What is a good organic trial-to-paid conversion rate for SaaS?
What is AI citation share and how do you measure it?
Should SaaS companies track keyword rankings at all?
How long before SaaS SEO metrics start moving?
What SEO metrics do SaaS boards actually ask about?
How do you attribute SaaS revenue to SEO?
What is the difference between leading and lagging SEO metrics?
Want reporting that survives a board meeting?
We instrument this on every engagement, and we baseline AI citation share before changing anything so movement is provable.
From $5,000/mo · Reporting on trials and pipeline, not sessions